
Elementary Experience
Photo by NeONBRAND
The Business Problem
Schoology was losing out on an estimated 10M ARR due to poor adoption of the learning management system with teachers in students in grades K-5. Other competitors like Seesaw lead in the market with more elementary-friendly user experiences and features for parents.
My Role
Lead Designer. Responsible for everything from research to design delivery.
Initial Research

Evaluating the Current State
Using the Nielsen Norman group’s research document “UX Design for Children” I led multiple sessions with our PM and another designer to evaluate the current solution and how it stacks up for elementary students.

Visual & Interactive Inspiration

User Interviews
I conducted 10 elementary teacher interviews and synthesized the findings.

Planned Research
Due to an unexpected global pandemic and Schoology being acquired by Powerschool we were unable to conduct the additional research studies I had planned including a field study to elementary classrooms across the USA and a diary study with parents of elementary students
Key Research Insights

1
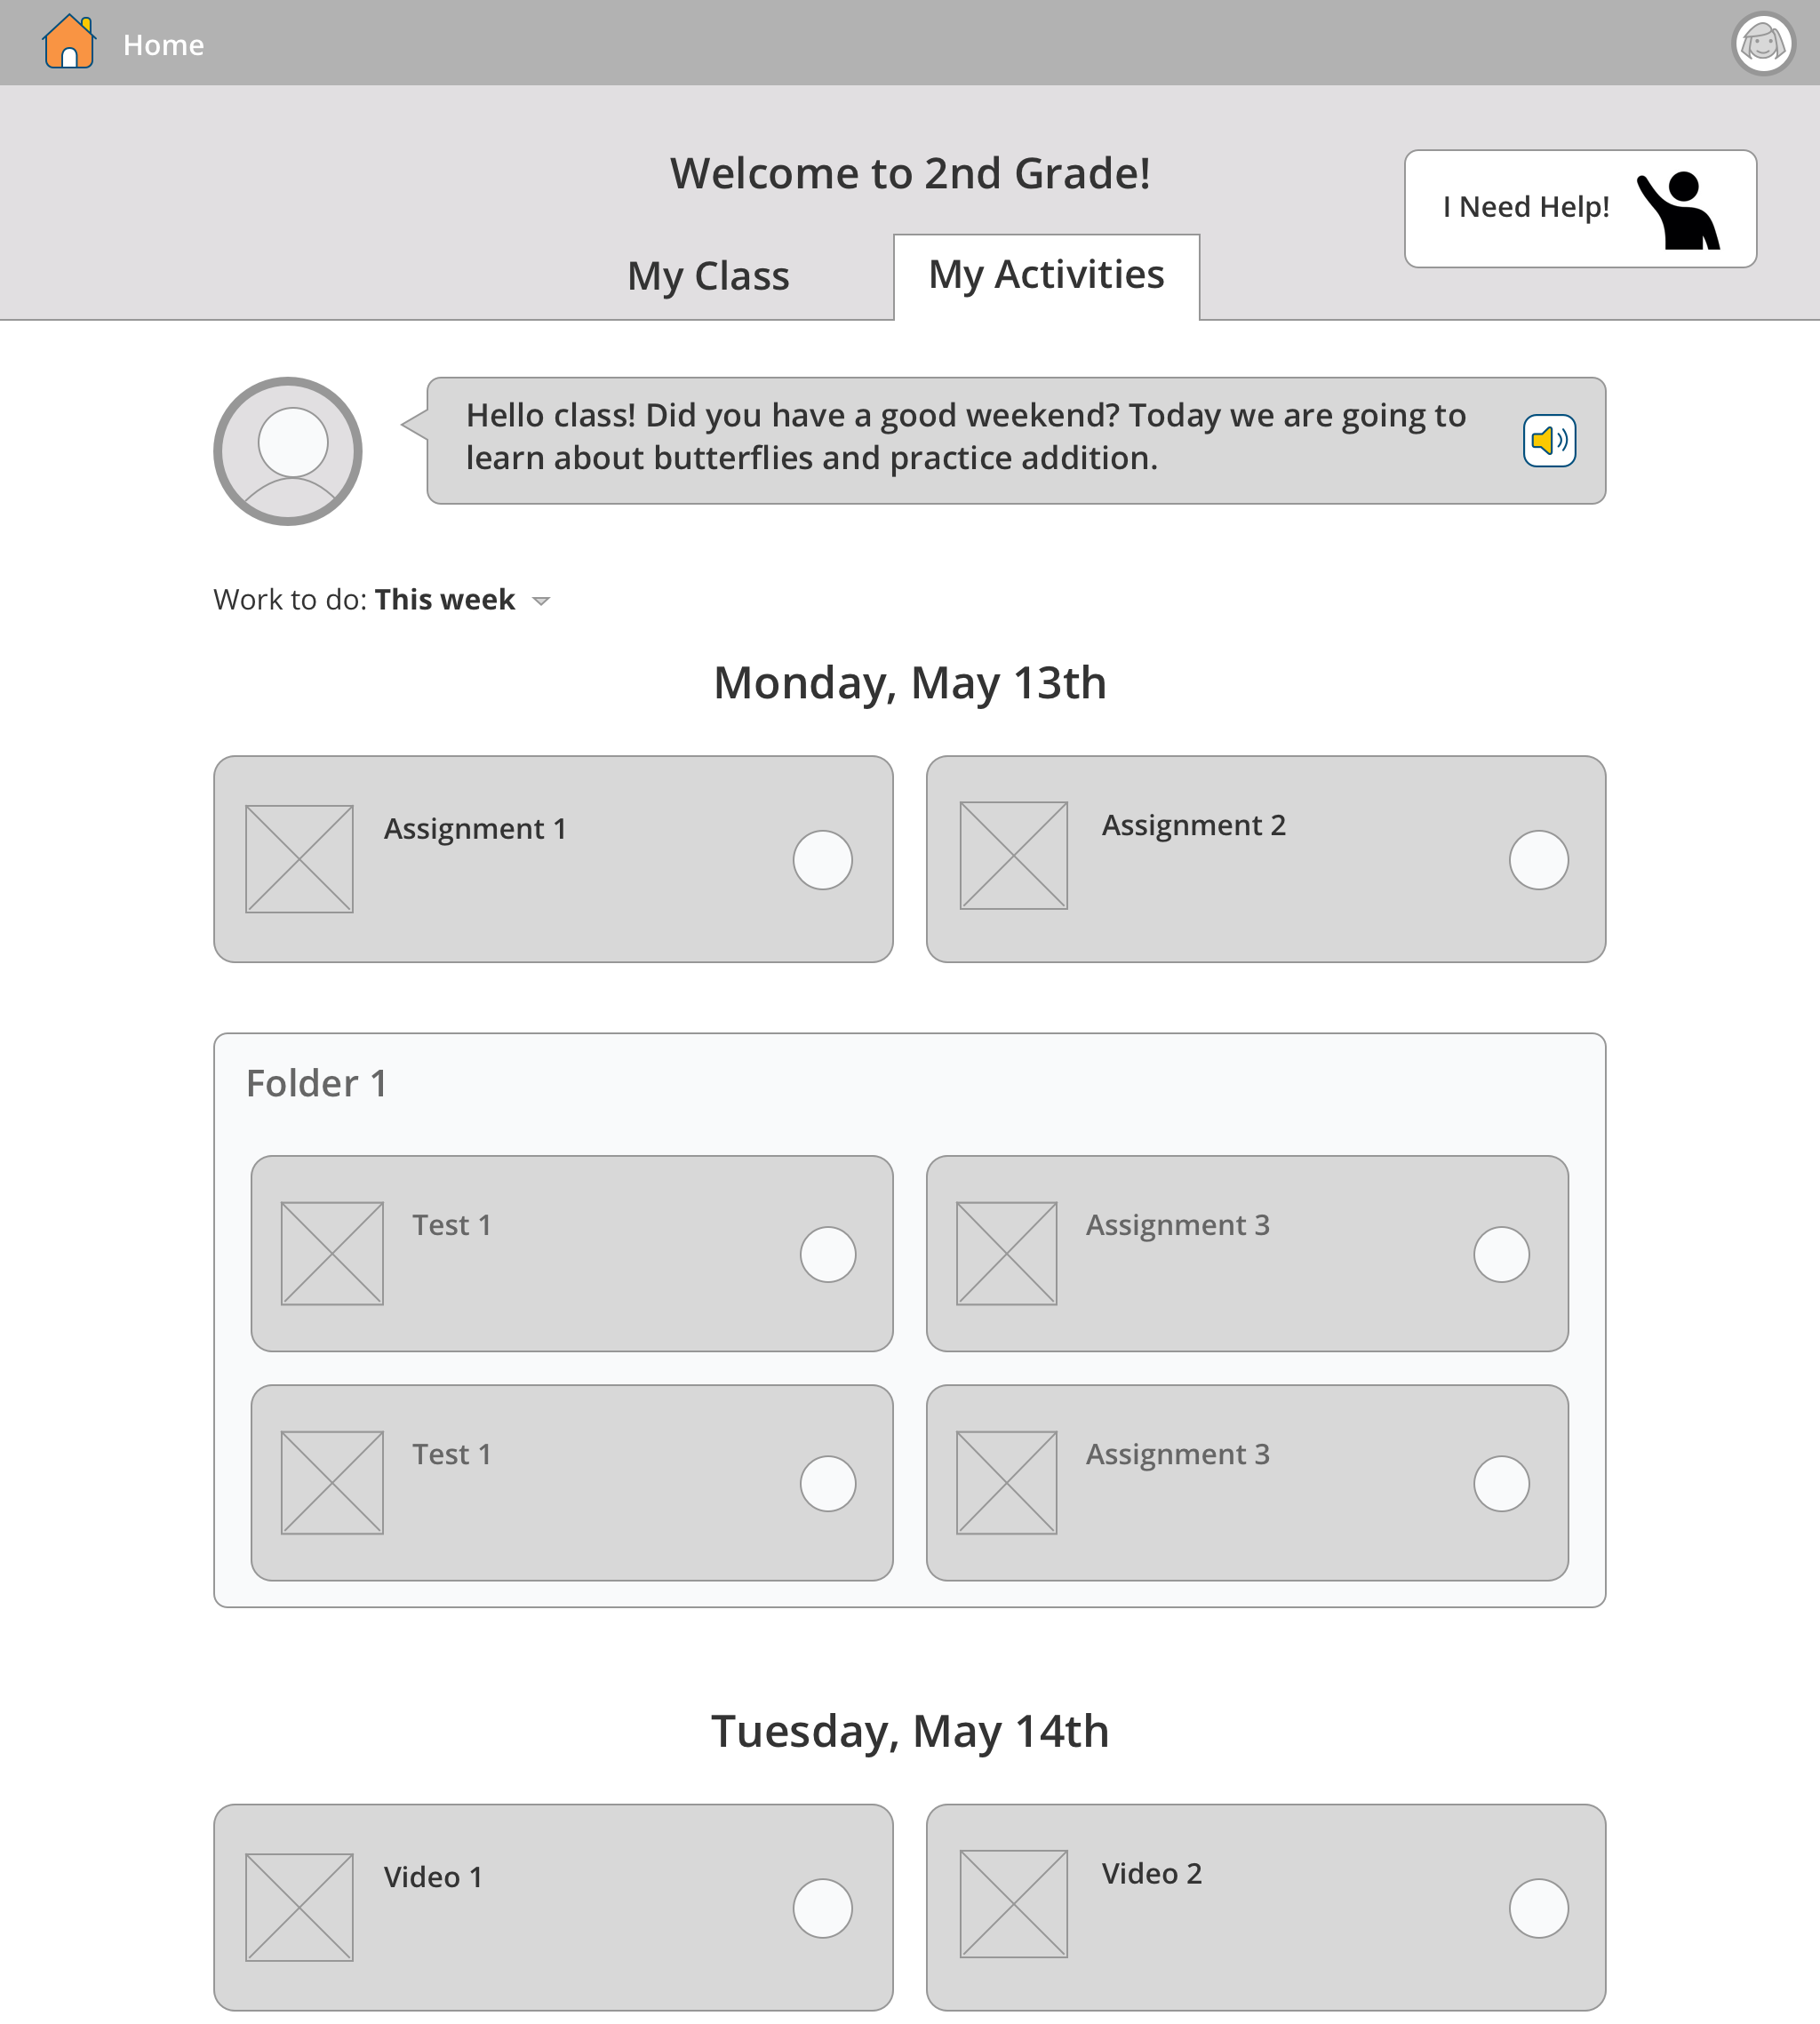
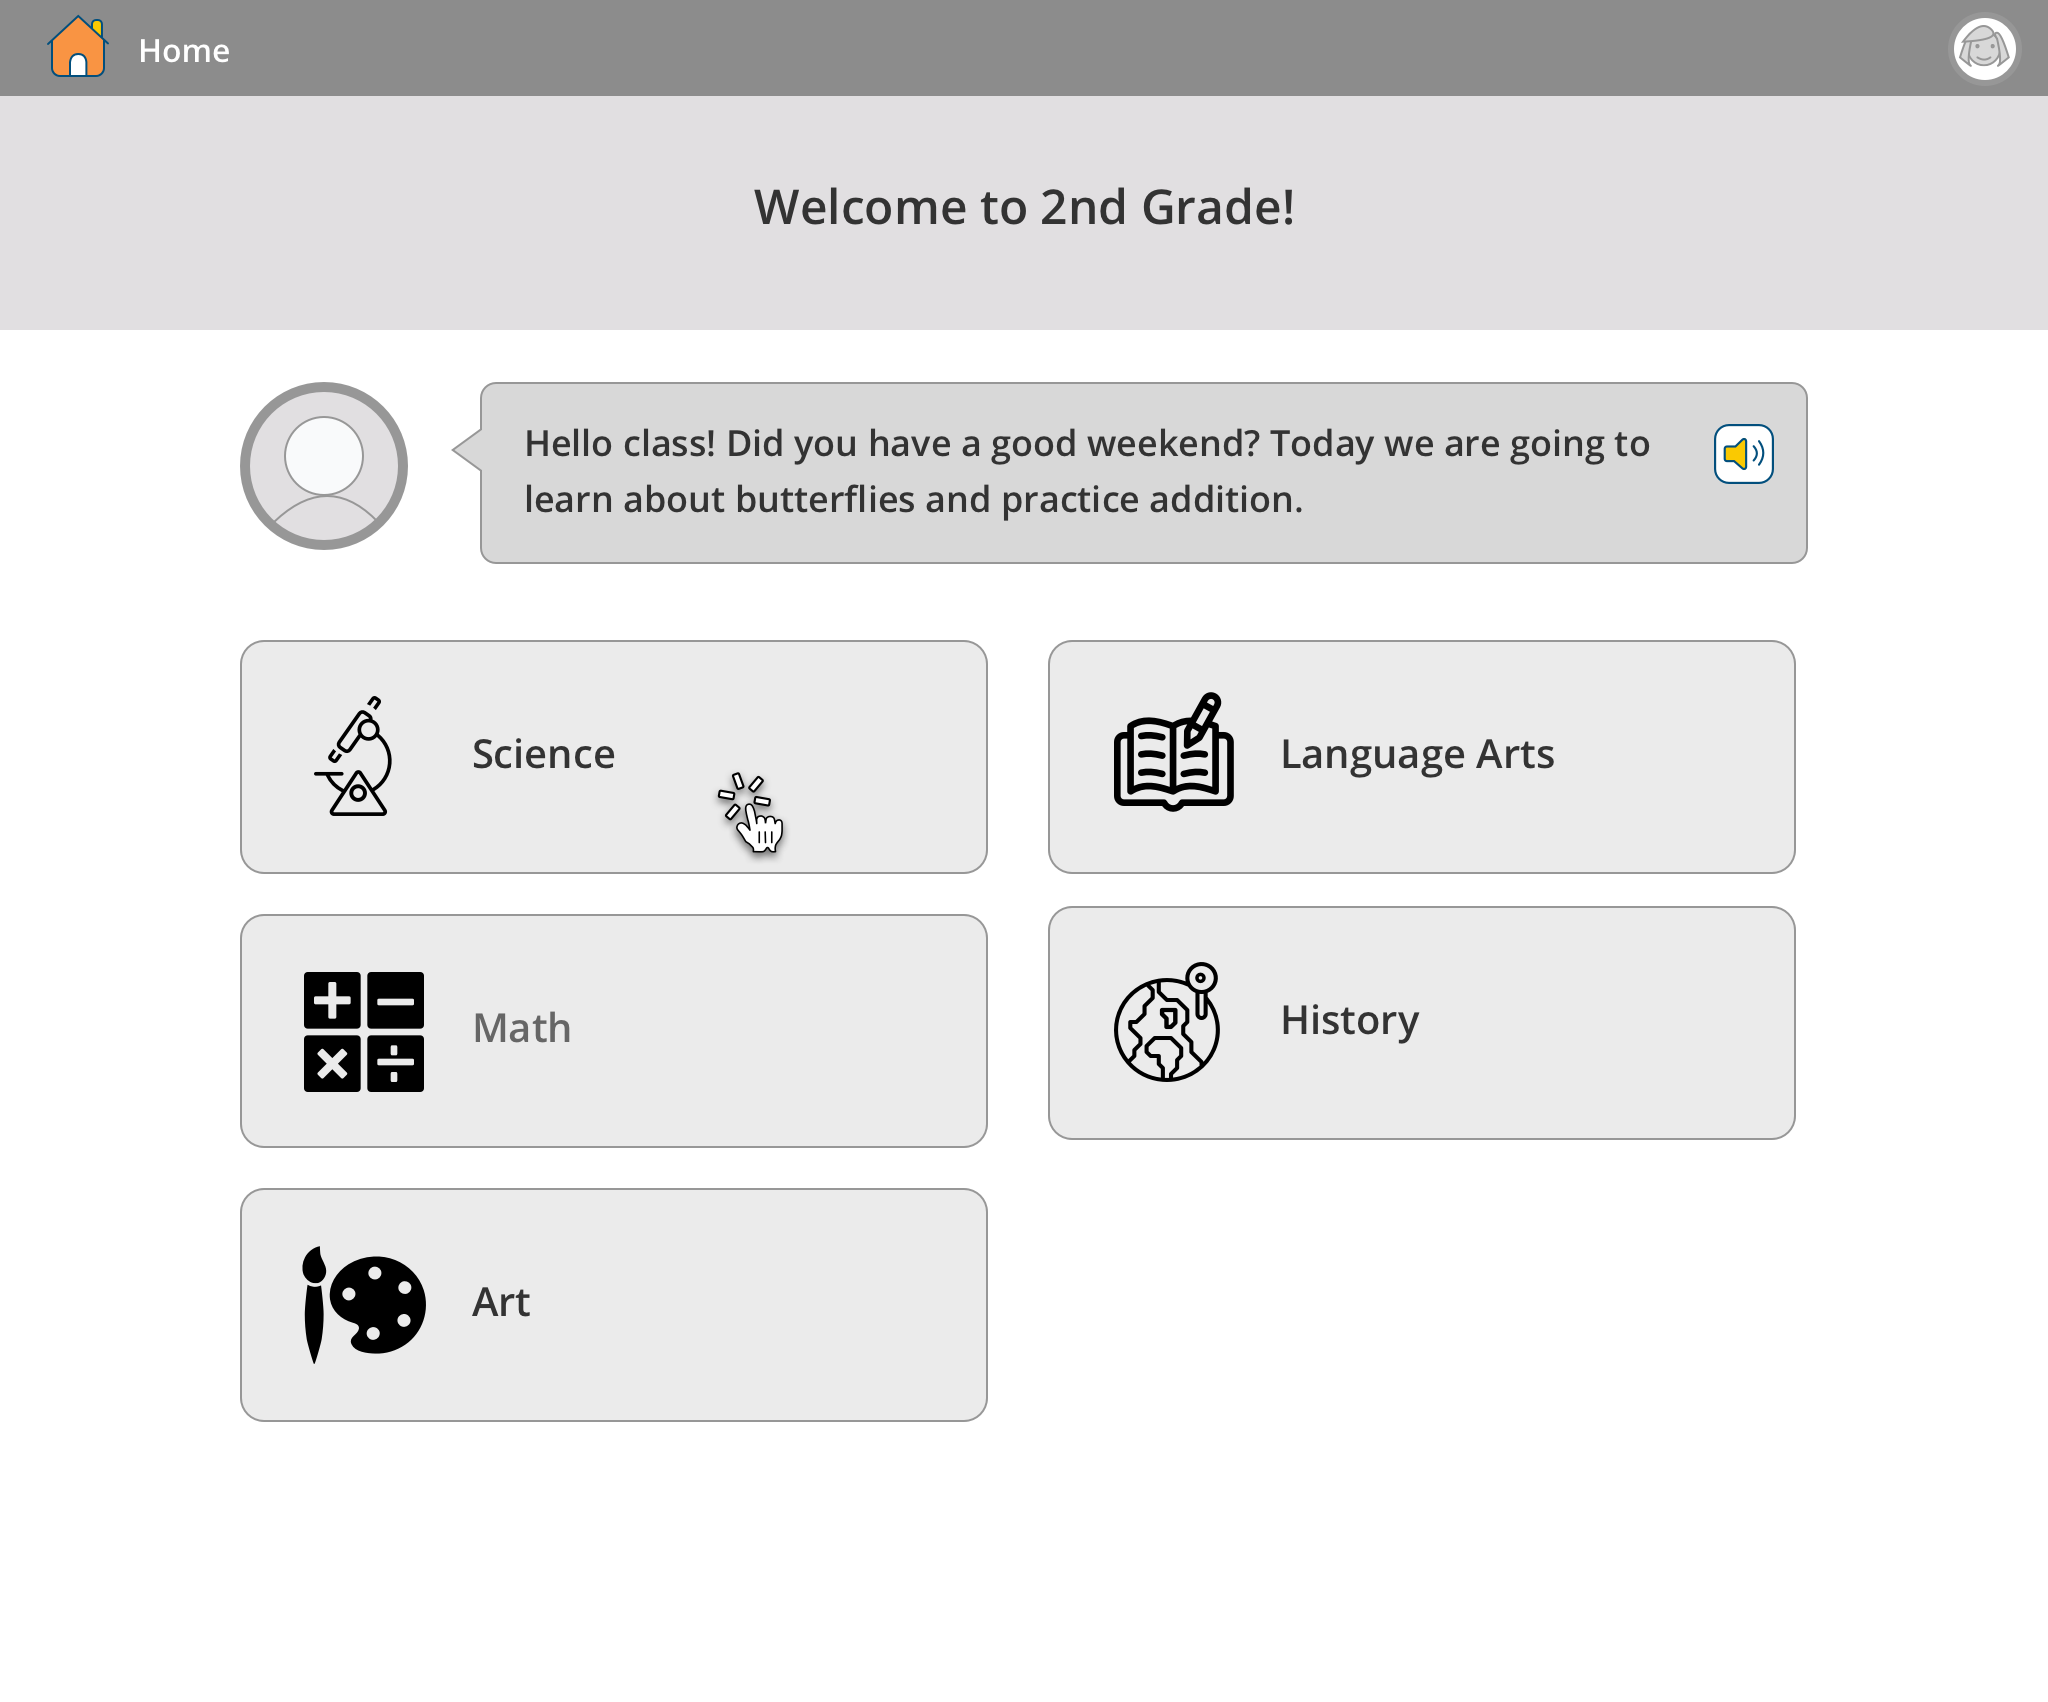
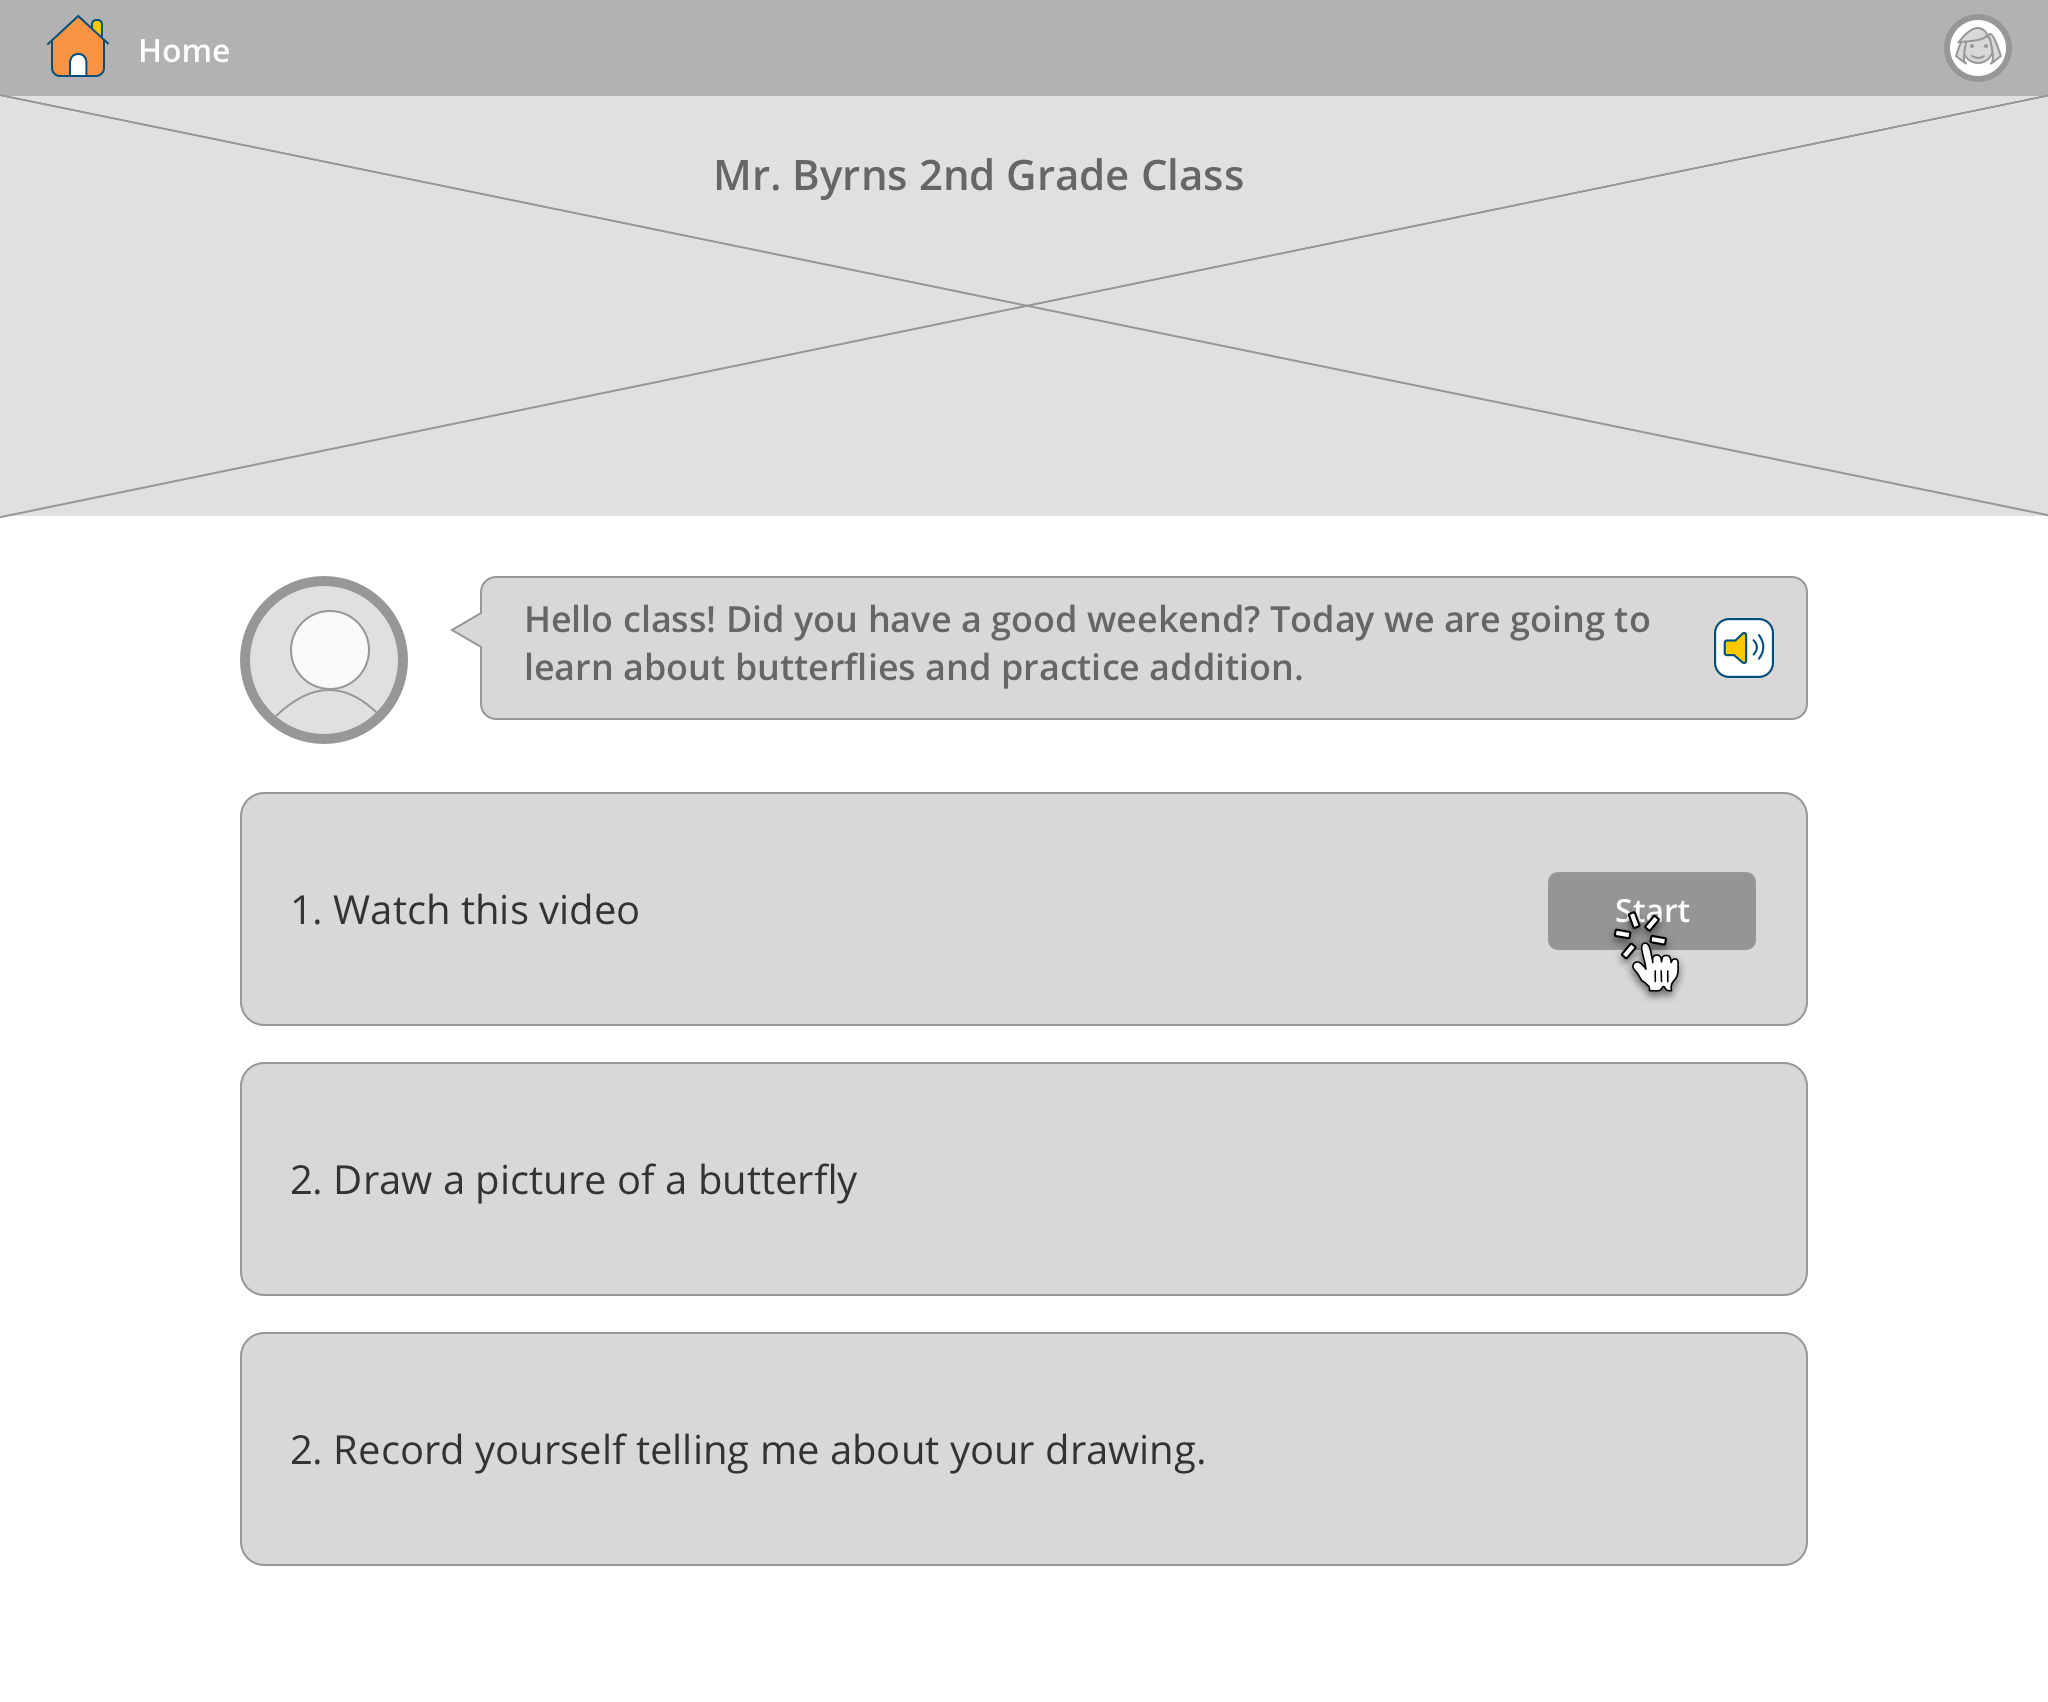
The current experience relies heavily on text which doesn’t support a large portion of elementary students, pre-readers (students not yet able to read.)

2
A lack of parity between the web experience and the mobile experiences (iOS and Android) creates frustration for teachers when trying to help students who are struggling.

3
Content is buried and requires many clicks to access materials. Teachers spend too much time organizing their courses just so students can find assignments and resources.
The Vision
Wireframes
After researching needs for elementary students I started to wireframe different experience approaches for navigation to courses and content.


User Testing
Opting for both breadth and depth, I created an unmoderated click test and conducted moderated interviews to gather feedback about the design direction.
Examples of the design iterations I tested


Key Research Insights

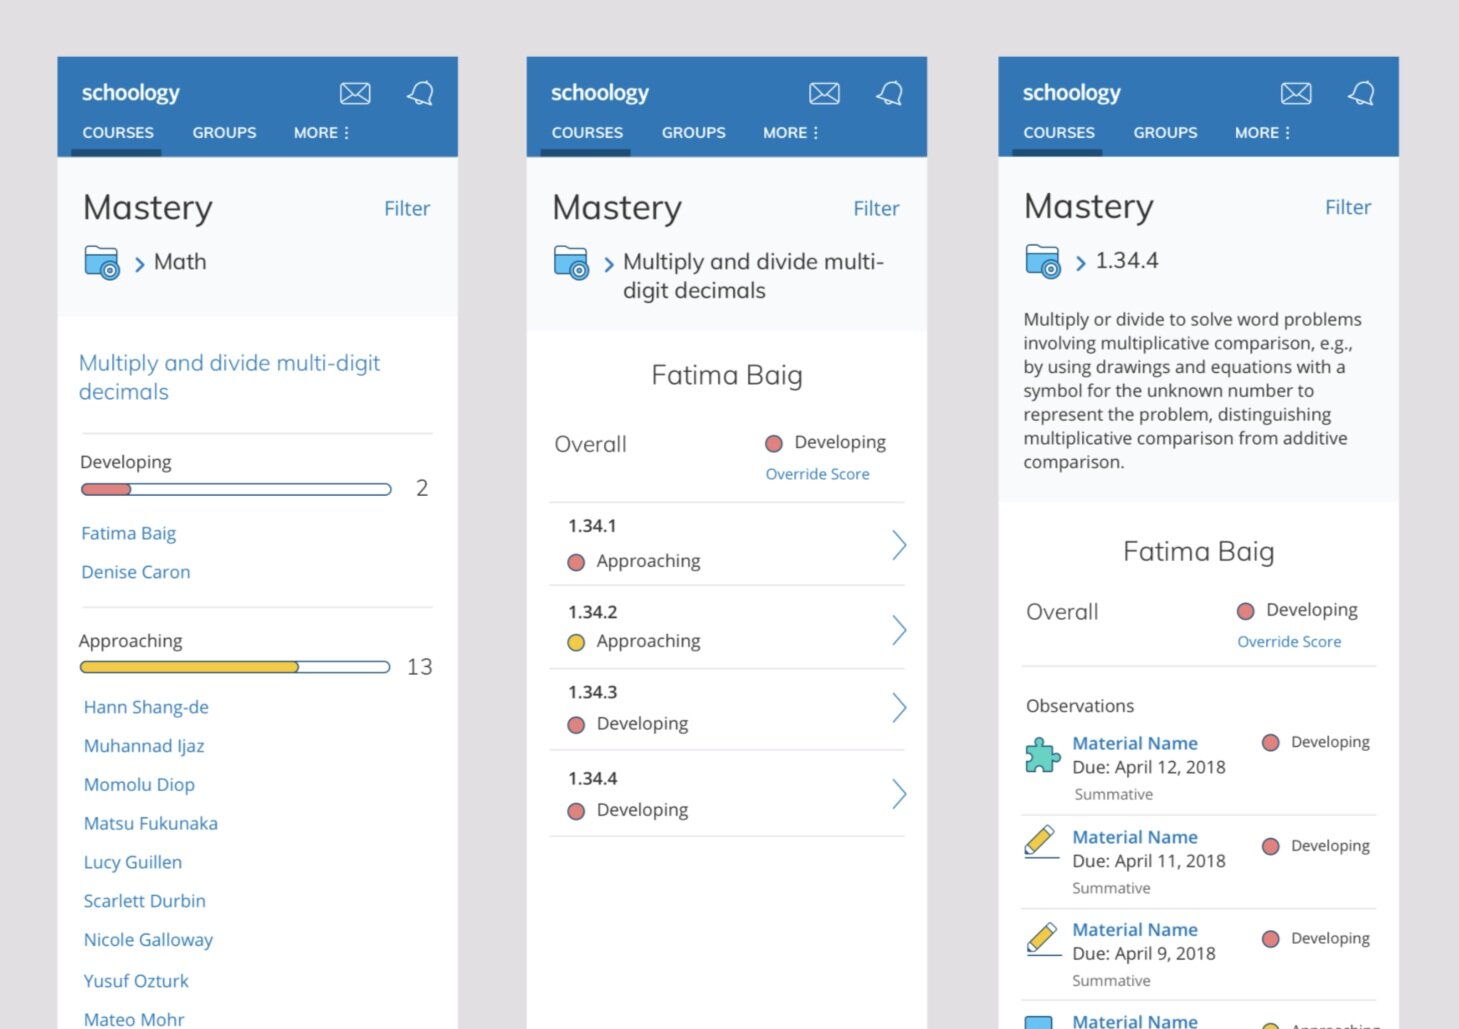
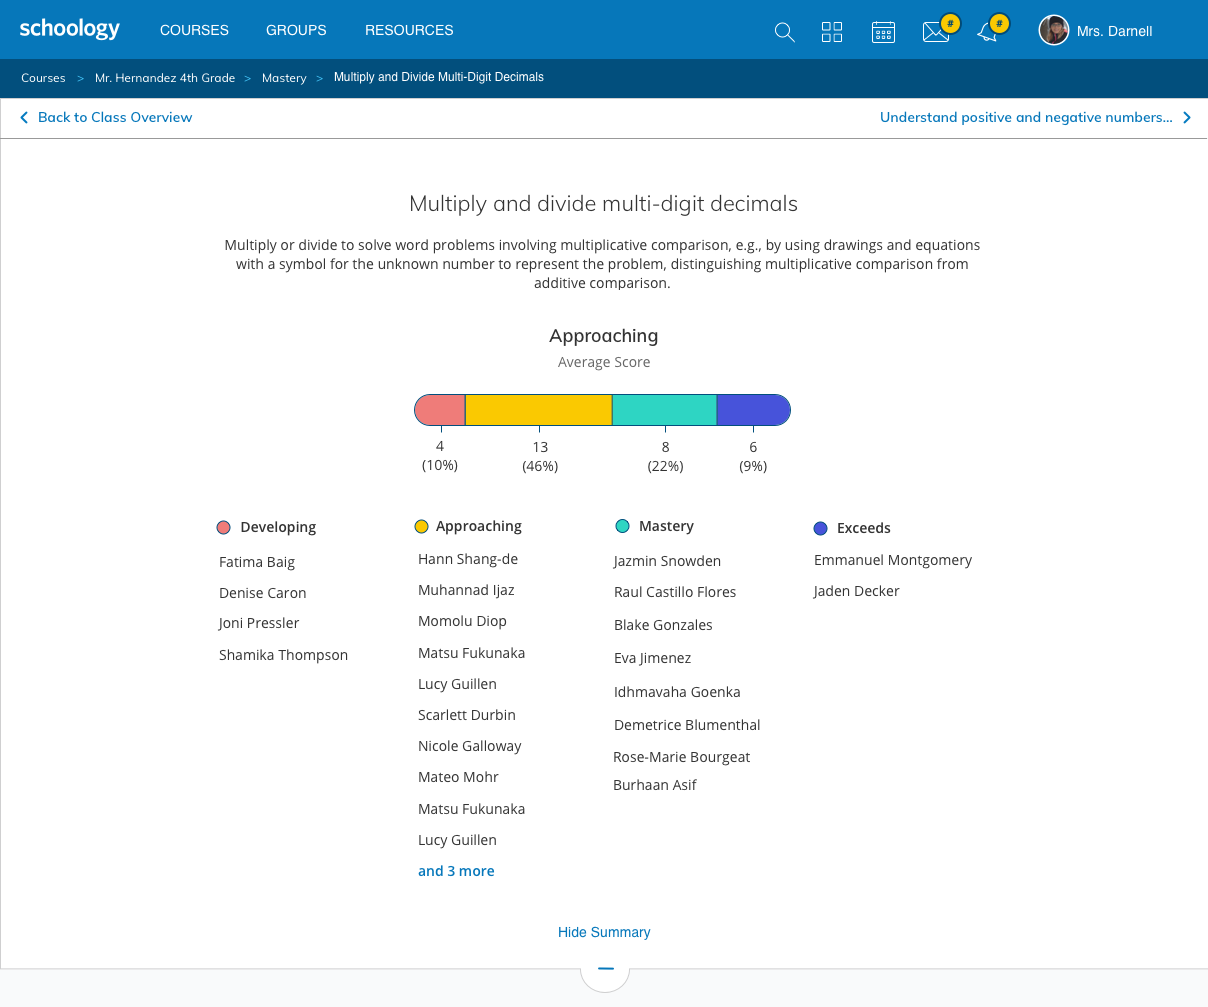
1
Teachers want to use mastery data to place students into groups for more focused instruction on particular topics. This type of view was particularly exciting for teachers. They wanted to use this to create balanced student groups

2
While I hypothesized that full color cells would be overwhelming, I learned through concept tests that colorful heat-maps help teachers to get a better sense of the class’s progress. The more minimal design shown here made it harder for teachers to gauge their class’s understanding.
Final Design


Business Impact
Increased demo requests by 450% - the most of any Schoology email marketing campaign
Exceeded pilot goal of 30 school districts using the Mastery-Based Gradebook by 250% within 2 months of release